Introduction: The Power of Numbers in Real Estate
When it comes to real estate investing, emotions can mislead you, but numbers rarely do. Many investors are drawn to Edmonton because of its affordable entry prices, healthy rental demand, and above-average cash flow potential. But how do you know if a 10-unit apartment building is worth the investment?
The answer lies in creating a pro forma: a forward-looking financial statement that estimates income, expenses, and returns. Let’s build one together for a 10-unit apartment in Edmonton so you can see exactly how investors evaluate opportunities.
Step 1: Estimate Gross Rental Income
Every analysis begins with rents. Edmonton’s average rents (as of mid-2025) look like this:
- 1-Bedroom: $1,150/month
- 2-Bedroom: $1,400/month
Suppose our 10-unit building is composed of 10 one-bedroom units.
- Monthly gross rent: $1,150 × 10 = $11,500
- Annual gross rent: $11,500 × 12 = $138,000
But this is the theoretical maximum if every unit is always occupied. In reality, you’ll face vacancies and turnover.
👉 Edmonton’s vacancy rate is roughly 4–5%. Let’s assume 5%.
- Effective Gross Income (EGI): $138,000 – $6,900 = $131,100
Step 2: Subtract Operating Expenses
Expenses vary by property, but a realistic pro forma for Edmonton would include:
- Property Taxes: Edmonton averages about 1% of assessed value per year. For a $900,000 building: ≈ $18,000.
- Insurance: $6,000 annually for mid-sized multi-family.
- Maintenance & Repairs: Budget 8–10% of gross rents = ~$12,000.
- Property Management: 10% of collected rents = ~$13,000.
- Utilities (if landlord-paid water/heat): ≈ $10,000.
Total Operating Expenses: $59,000/year
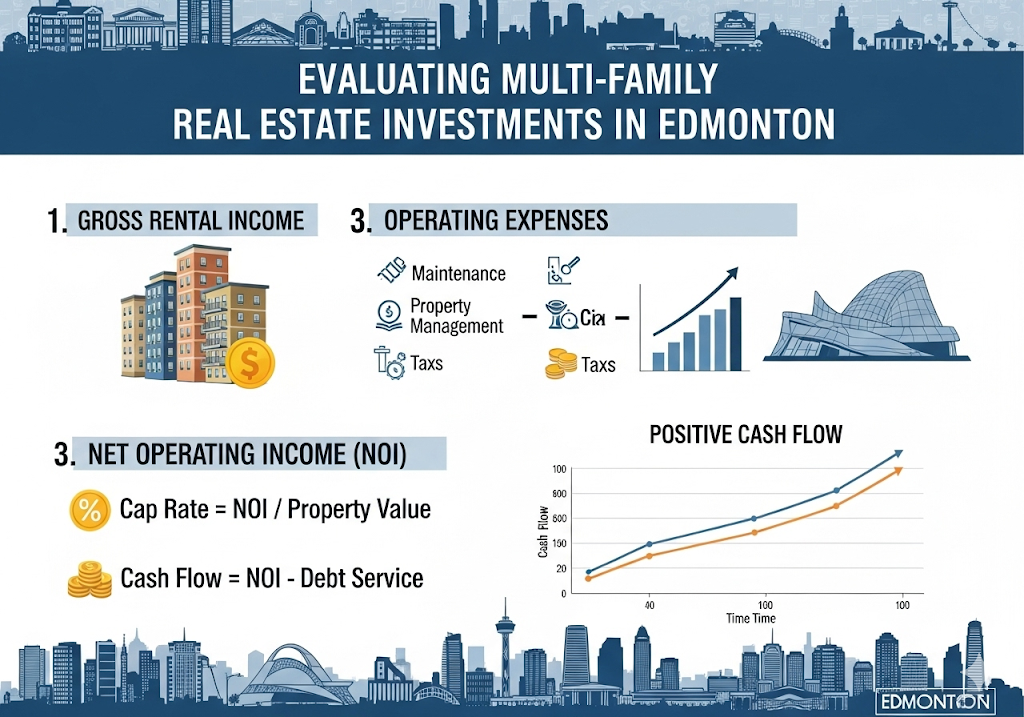
Step 3: Net Operating Income (NOI)
- Effective Gross Income: $131,100
- Operating Expenses: $59,000
= $72,100 NOI
👉 NOI is the backbone of any investment analysis because it shows the property’s income before mortgage payments.
Step 4: Key Metrics Every Investor Should Know
1. Cap Rate (Capitalization Rate)
Formula: NOI ÷ Purchase Price
- NOI = $72,100
- Purchase Price = $900,000
Cap Rate = $72,100 ÷ $900,000 = 8%
✅ A strong result. In major cities like Toronto, you might only see 3–5%.
2. GRM (Gross Rent Multiplier)
Formula: Price ÷ Gross Rental Income
- $900,000 ÷ $138,000 = 6.5
A GRM under 7 is considered very healthy in many Canadian markets.
3. Cash Flow (After Financing)
Assume:
- 25% down ($225,000)
- $675,000 mortgage @ 5% interest, 25-year amortization
- Annual debt service ≈ $47,600
Cash Flow = NOI – Debt Service
= $72,100 – $47,600
= $24,500/year positive cash flow (~$2,041/month)
👉 This means even after paying the mortgage, you’re pocketing steady income.
Step 5: Bigger Picture – Why Edmonton Makes Sense
- Lower Entry Prices: $90K–$120K per door, compared to $300K+ in Vancouver/Toronto.
- Room for Cash Flow: Investors can still find deals that generate positive monthly income, which is nearly impossible in overheated markets.
- Population Growth: Alberta attracts migrants for affordability and jobs, fueling rental demand.
- Cap Rate Advantage: Edmonton regularly posts 6–8% cap rates, while other cities struggle to hit 4%.
Conclusion
Breaking down the numbers turns real estate from a guessing game into a disciplined investment. In our example, a 10-unit Edmonton building generates:
- 8% cap rate
- 6.5 GRM
- $24,500 annual cash flow
For investors seeking both steady income and long-term upside, Edmonton remains one of the most compelling Canadian markets. The secret? Let the numbers do the talking.